Tutorials
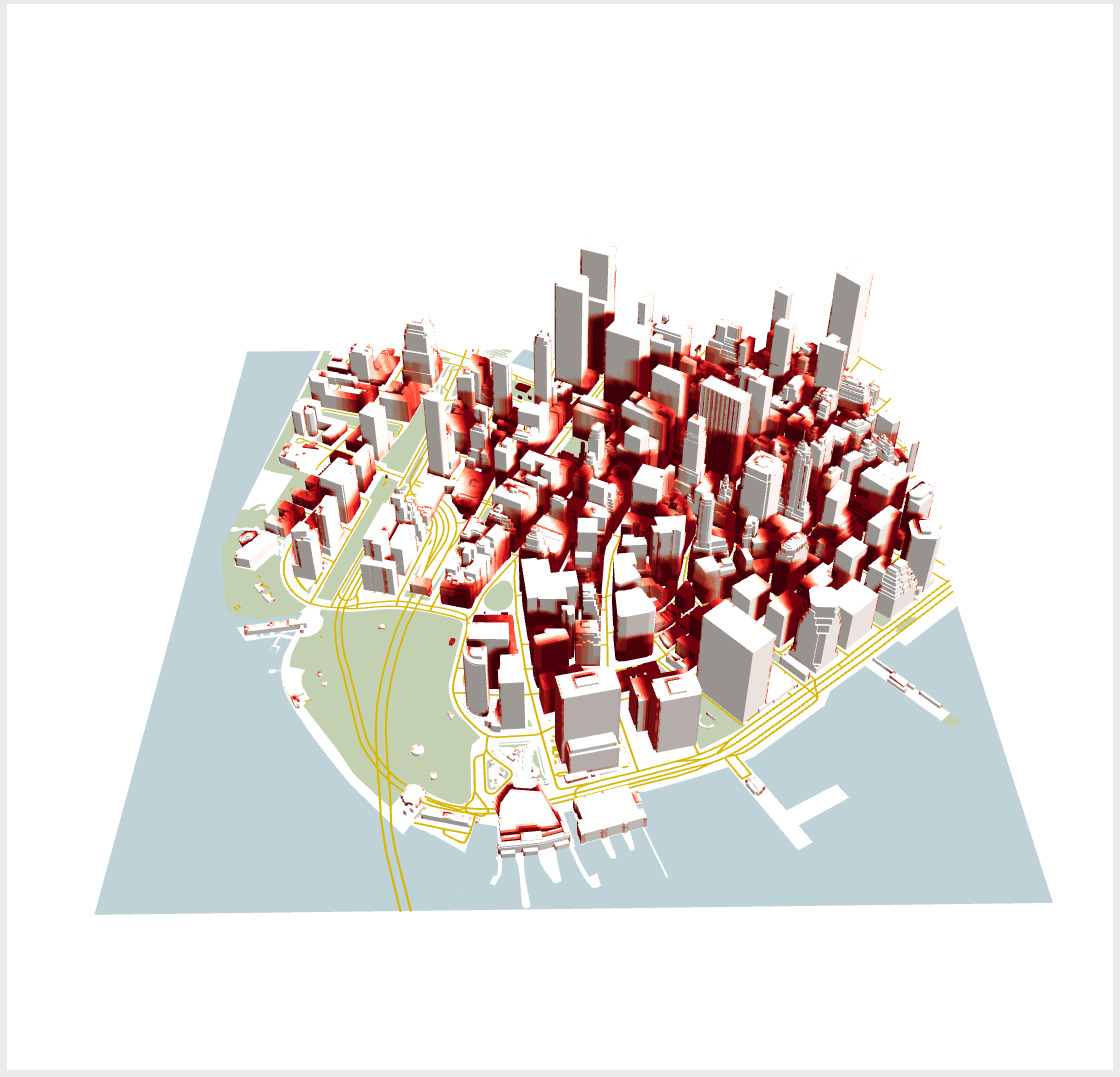
Shadow in Downtown NYC
In this example, we visualize how Shadow can have a significant impact on a highly dense region of New York City. Moreover, we define a bar chart to help us get a quick overview of the data.
What-if Scenario
This tutorial walks you through the process of defining a what-if scenario in downtown Chicago. You will get to use shadow simulation data from two different scenarios to analyze the impact a few buildings can have on Millennium Park.
Multiple Datasets
This example illustrates the power and simplicity of UTK by teaching you how to aggregate multiple datasets considering the Zip code boundaries of Manhattan (NYC). To enhance the analytical capabilities we define a parallel coordinates chart to support the exploration.
Other examples (direct link to JSON files):
Example 1: Building energy efficiency
Example 2: Historic preservation
Example 3: See “multiple datasets” example above
Example 4: Tripping risk in Downtown Boston